


 68 / 100

basis of performance specification of ILI systems. The
performance specification was made by modelling and pull-
through tests. Statistical analysis of the data was performed
with STATUS 5 Eclipse Scientific software.
Modelling
Simulations in CIVA software were performed to provide
constructive delay laws and beam computations, to enable
it to cope with the multiple materials and the complex
geometry of the prototype concept.
Beam computations were performed for different
media and pipeline diameters, and the correspondent beam
profile was assessed in predefined computational areas.
The developed system can extend the operating
envelope to lower velocity media. Therefore, the diameter
of the UT beam at the pipe surface can be established
according to the inspection requirements; Figure 2 shows an
example through a computational plane placed on the back
wall of a 28 in. pipeline, with light crude oil at 1350 m/s.
Pull-through tests
In March 2018, pull-through tests were performed in order
to establish the performance specification on a 28 in.
carbon steel test pipe spool with artificial manufactured
pinhole and pitting type defects, with medium density
crude oil (API gravity 26) as an inspection medium. Metal
losses were represented by two types of geometries: flat
bottomed holes (FBH) and hemispherical bottomed holes
(HBH).
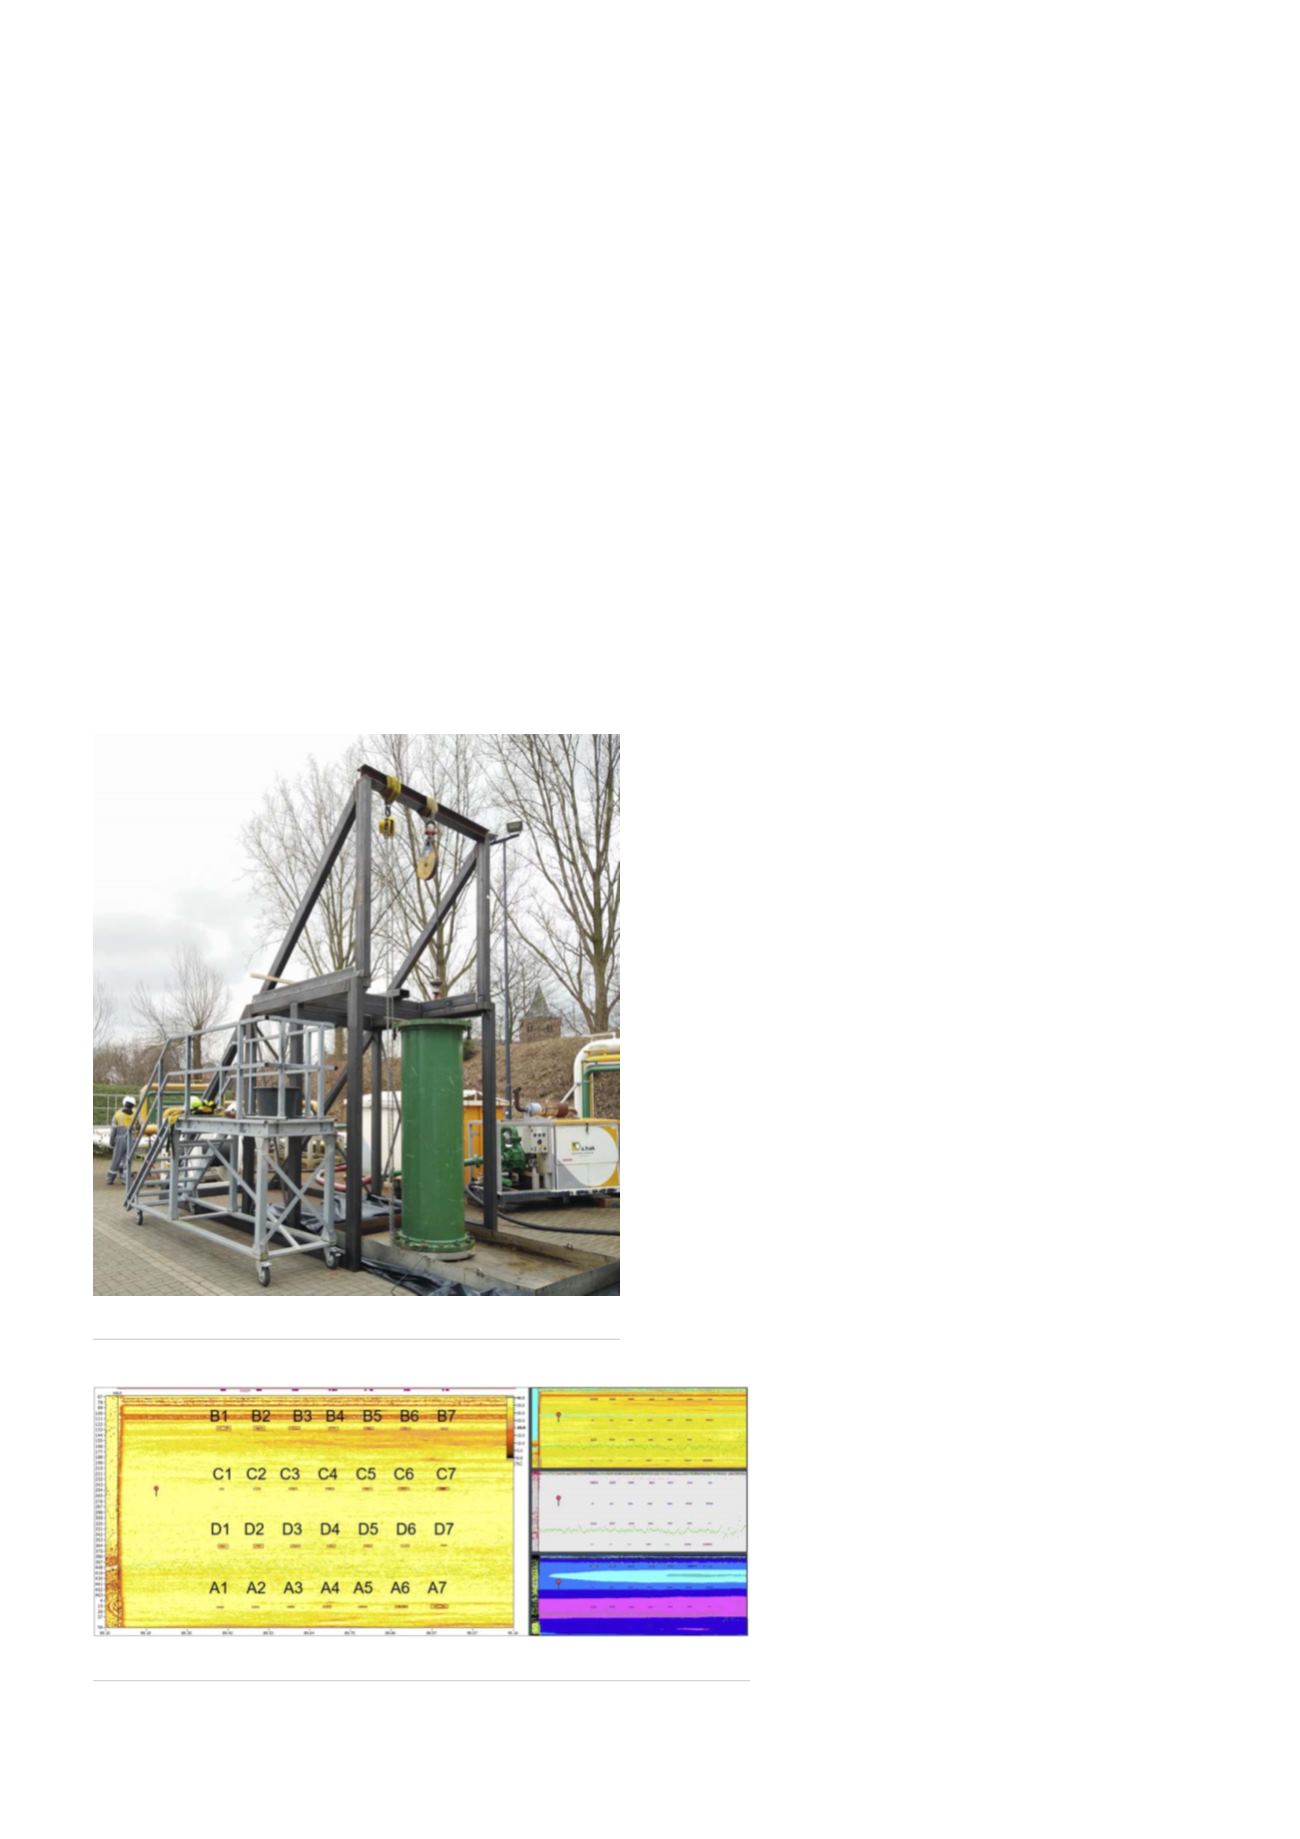
Figure 3 shows the test set-up for the pull-through tests.
12 runs were performed at an inspection speed of 100 m/h
– 470 measurements per revolution – enabling a measuring
grid of approximately 4.6 mm × 4.2 mm, circumferential and
axial, respectively.
Sizing of the detected flaws was performed by data
analysts. Figure 4 shows the C-scan images of one of the
pull-through runs performed.
Probability of detection and sizing curves
The probability of detection (POD) is the probability
that a feature with size a will be detected by the ILI tool.
According to the POF’s ‘Specifications and requirements for
inline inspection of pipelines’ (2016), two features can be
extracted:
)
A 90/50 (a90) is the feature size at which the average
POD is 90%.
)
A 90/95 (a90/95) is the feature size at which the lower
95% confidence limit of the POD is 90%.
All metal losses, represented by FBHs, were detected
in all the runs. These are not considered in Figure 5. The
two smallest HBHs were not detected, both internal and
external (Figure 5).
Regarding metal losses, for FBH, the tool has a depth
sizing accuracy of
±
0.1 mm, length sizing accuracy of
±
7.3 mm and height of
±
12.2 mm, with a 95% confidence
level. For HBH, it has a depth sizing accuracy of
±
0.2 mm,
length sizing accuracy of
±
5.4 mm and height of
±
10.8 mm,
with a 95% confidence level.
Case study
The tool developed has been deployed over several
projects. One of these projects was for a European pipeline
owner.
Pipeline characteristics
The pipeline had the following characteristics:
•
Diameter: 28 in.
•
Nominal wall thickness: 7.9 mm, 9.5 mm,
and 12.7 mm.
•
Length: 110 m.
•
Operational product: crude oil.
•
Inspection medium: crude oil.
As a part of the pig launcher, a validation
spool is installed. The spool contains artificial
metal loss defects, with known dimensions.
Figure 3.
Pull-through test set-up.
Figure 4.
Data acquisition C-scans.
66
World Pipelines
/
MARCH 2020