


 74 / 100

24 hours a data quality assessment was conducted and presented
to the operator, which includes a human-based evaluation of
the data from a level three data analyst to confirm the quality
of the data. The data was confirmed to be 100% within the
pipeline operator’s specification and 100% sensor coverage of all
technologies. Over the next 45 days, the data was analysed, and a
final report was presented.
Tool capabilities
With ENTEGRA’s UHR combination tools, the long seam weld
of a pipe is found to be much more visible, identifiable, and
measureable. Like many other threats, detection of corrosion on
the long seam of this 30 in. pipeline was critical. Not all corrosion
on or along the long seam weld is treated equally, but seeing it
and characterising it as coincidental or preferential is a priority
and helped this operator make decisions on what they needed to
address. Because the long seam can be seen in the data, the metal
loss may also be assessed, and the pipeline operator can prioritise
action of the anomalies, down to the pinhole sized metal loss.
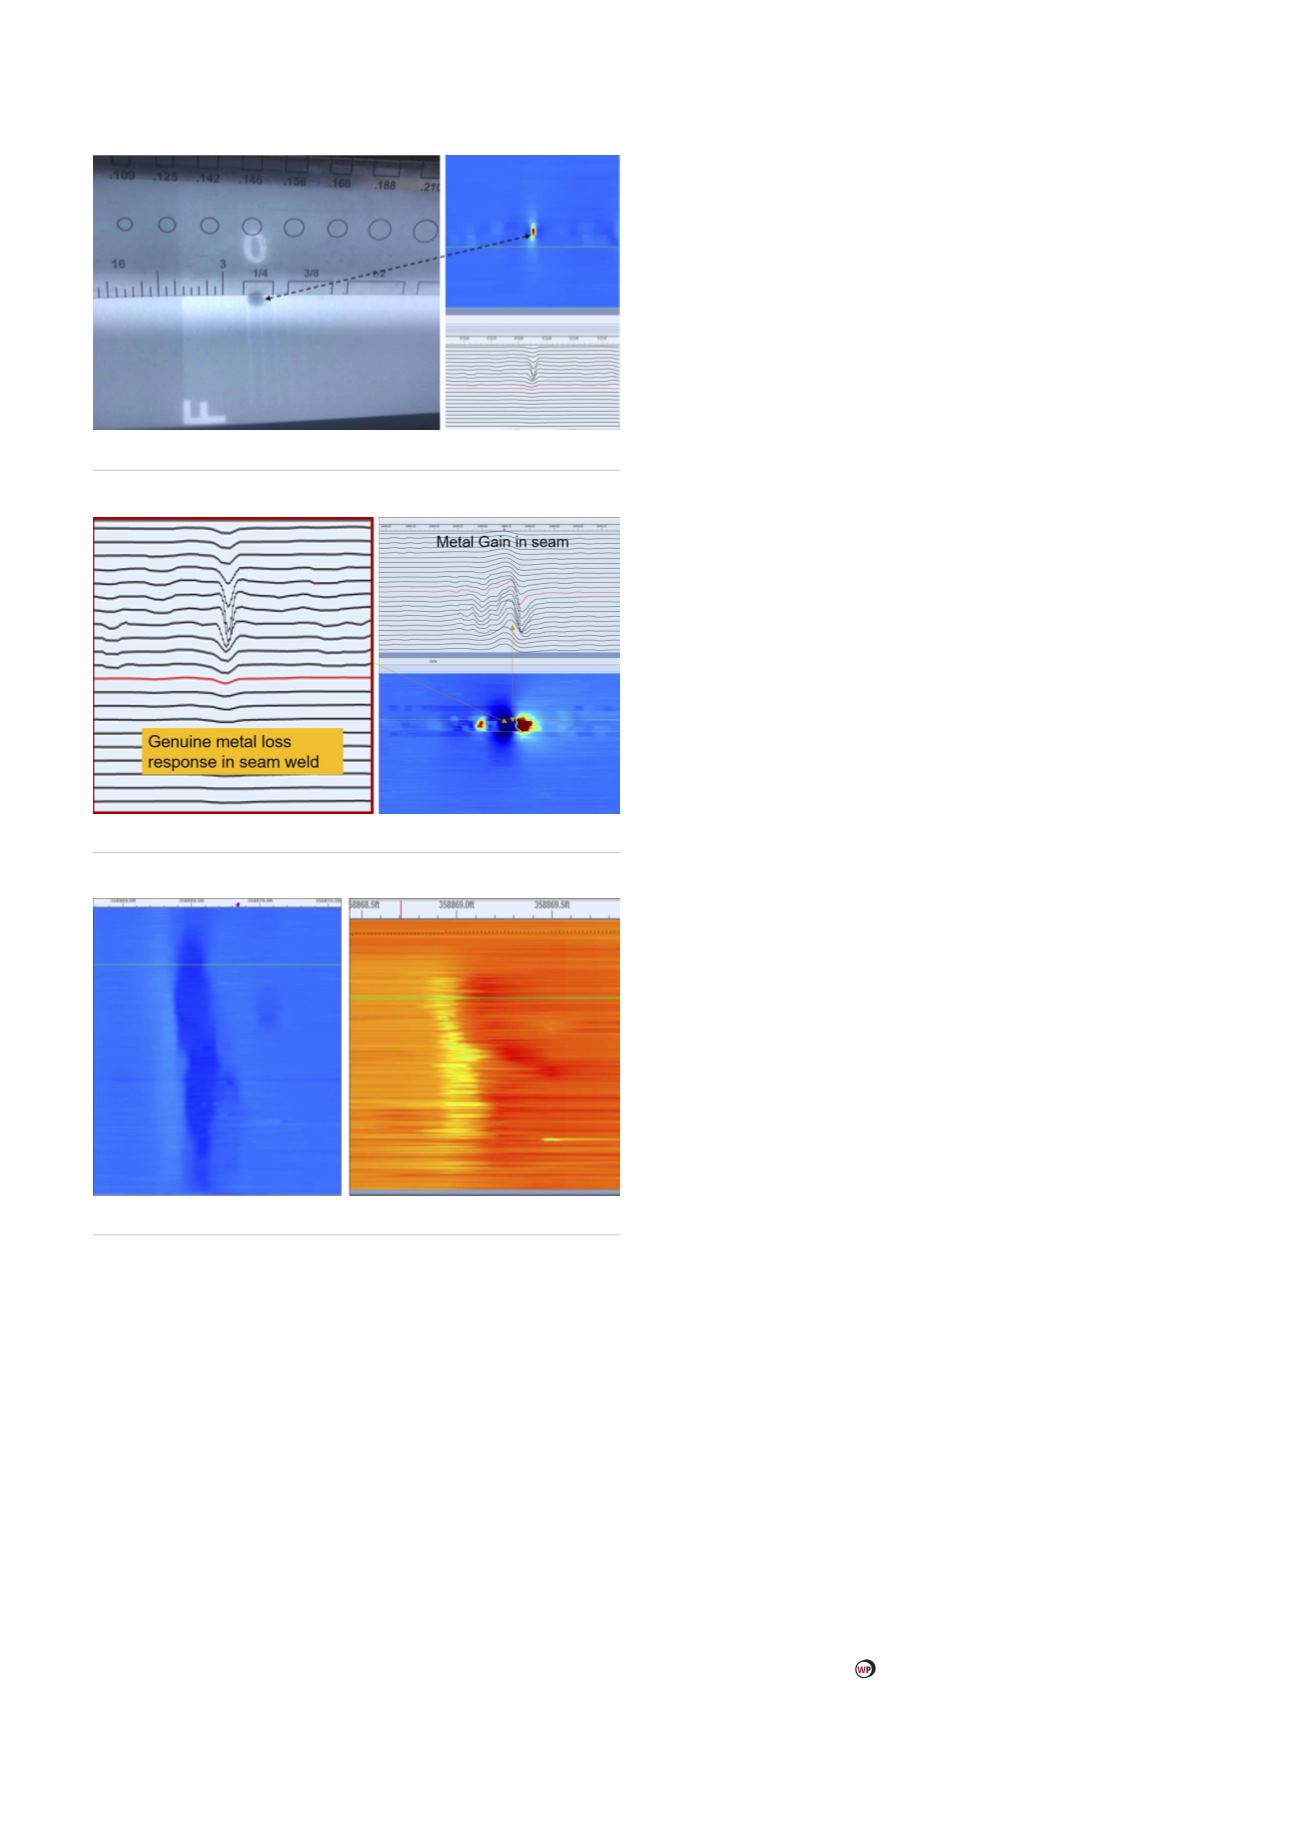
Not previously reported, Figure 2 is a screenshot of a pinhole
found on the long seam. The specific pinhole found was unique
because it was missed by conventional handheld UT devices
on the first attempt to locate. After the handheld UT device
failed to locate the pinhole, the operator deployed more precise
NDE methods, and it was found and validated by using X-ray
equipment. Once validated, the pipeline operator was able to
prioritise and address it.
Due to the enhanced sample rate and sensor density of
ENTEGRA’s UHR combination tools, the company provide
a pinhole specification to help pipeline operators detect,
characterise, and size pinholes in their pipelines. This was a
deliverable the previous ILI vendor was not able to provide, and
was becoming increasingly important to the operator to detect
and size. Figure 3 is a screenshot of the X-ray of that same pinhole
in Figure 2, found on the long seam of the pipe. This defect was
found to be approximately 3.5 mm in diameter and directly in the
long seam weld.
UHR data also enables the detection of seam variations.
The image on the left in Figure 4 exemplifies what a genuine
metal loss signature looks like in a seam weld. To the right is
what a metal gain looks like in the seam. The previous ILI vendor
reported a 58% metal loss depth, whereas ENTEGRA’s UHR data
called out a metal gain and rough seam welding. The detection,
sizing, and prioritisation of this anomaly was a critical find for the
pipeline operator, given the expansive HCAs this pipeline runs
through.
Detection of hard spots is another capability of ENTEGRA’s
UHR tools and expert data analysis team. Hard spots are changes
of hardness of the pipeline in localised areas, and are of specific
interest in this 30 in. pipeline. These hard spots can derive from
the manufacturing process or general changes in the chemistry of
the steel. As the metallurgical values of hard spots are different
and unique, they are prone to failure such as cracking. The
detection of hard spots in this 30 in. pipeline in or near HCAs was
a priority. Figure 5 illustrates a hard spot that was found.
Conclusion
In conclusion, the ILI of this 30 in. natural gas pipeline was of
top priority for the pipeline operator because of its critical
distribution of product in multiple states, through multiple HCAs.
The operator chose multiple data set ILI tools, circumferential
ILI tools, and ENTEGRA’s UHR axial MFL/CAL/IMU combination
tool to inspect this pipeline for metal loss and other associated
threats. The overall speed profile utilising the UHR tool was
within specification, sustained 100% sensor coverage, and
navigated the back-to-back 1.5D bends without sacrificing data
quality.
Due to the combination of UHR axial MFL and UHR Caliper
data sets in conjunction with the MFL’s low field magnetic
capabilities, the pipeline operator was able to successfully and
accurately locate and address necessary threats such as hard
spots, dents with metal loss, and volumetric corrosion anomalies
down to the pinhole.
Figure 4.
Metal loss and gain signatures.
Figure 3.
X-ray of pinhole.
Figure 5.
Evidence of hard spot.
72
World Pipelines
/
MARCH 2020