


 62 / 100

has also been quick to participate in the modern ML era, using its
tools to increase efficiency, control costs, and support integrity
management. Applying ML techniques to inline inspections (ILI)
performed by intelligent pigs is improving the actionable data
that pipeline operators need to keep their systems running safely.
Expanding ML use
Given the current fervour for ML, it might be surprising to
discover that ILI providers have been applying ML since the
1980s, although at first it was not explicitly referred to as such.
Early models were constructed using a combination of finite
element modelling, statistical modelling, and predictive functions,
to address such challenges as predicting metal loss geometric
dimensions.
1,2,3
The application of formal ML techniques began in the
early 2000s with neural networks – that is, connected layers of
non-linear functions – being used to classify pipeline features
and identify mechanical damage. Since then, the application
of ML has improved metal loss sizing, fitting classification, and
the identification of interactive threats.
4
The development
of advanced ILI techniques such as electromagnetic acoustic
transducer (EMAT) and ultrasonic (UT) technology have generated
even more interest in ML as a way to analyse complex data sets.
Given its success, it is tempting to think of ML as a silver
bullet that can solve any problem. But the fact is, even when the
goal seems outwardly simple – to alert people about possible
credit card fraud – there is no single model that can be employed
with certainty, and often the goal has more complexities than
initially considered. The best solutions begin with well-thought
out, well-defined objectives; they often apply a combination
of multiple models that either feed into one another or are
ensembled together to produce a final prediction; and they rely
on good data, which is not always easy to assemble.
Fine-tuning data
Data curation – the process that includes collecting, analysing
and labelling the data used to train the mathematical model – is
a critical and time-consuming process. The quantity, quality,
and representation of the data directly influence the
performance of predictions made by the model. For example,
if you want to predict housing prices in Tulsa, Oklahoma, but
use a model trained on data from Los Angeles, California, then
the resultant predictions will be grossly incorrect. Even slight
nuances can manifest as misleading results. However, it is
possible to formulate the model to reduce the risk of error.
In many ways, implementing an ML model to accurately
identify possible integrity threats mimics the experience-based
approach of ILI data analysts who detect, identify, and report
signals recorded by ILI tools. Experience can be subdivided
into two categories, examples and outcomes, each of which
allows the data analyst to identify patterns and make future
predictions.
The same goes for supervised learning models. They make
predictions from examples and outcomes, and improve the
more ‘experience’ they have.
Supervised models use a one-to-one mapped set of
inputs (examples) and outputs (outcomes) to develop a
mathematical function that can be applied to new examples.
The input parameters are a vector of engineered features (that
is, important characteristics) that map to a desired outcome.
A model’s training data will include numerous examples: each
example will have a list of features, and each example will have
a desired outcome. The model uses this data arrangement to
learn rules that can be applied to future examples.
The beauty of these models is that they can be trained using
multiple features. At T.D. Williamson (TDW), for example, the
multiple data set (MDS) platform allows subject matter experts
to develop relevant, focused, and valuable input features that
can be used to train models, make integrity predictions, and
provide comprehensive threat assessment.
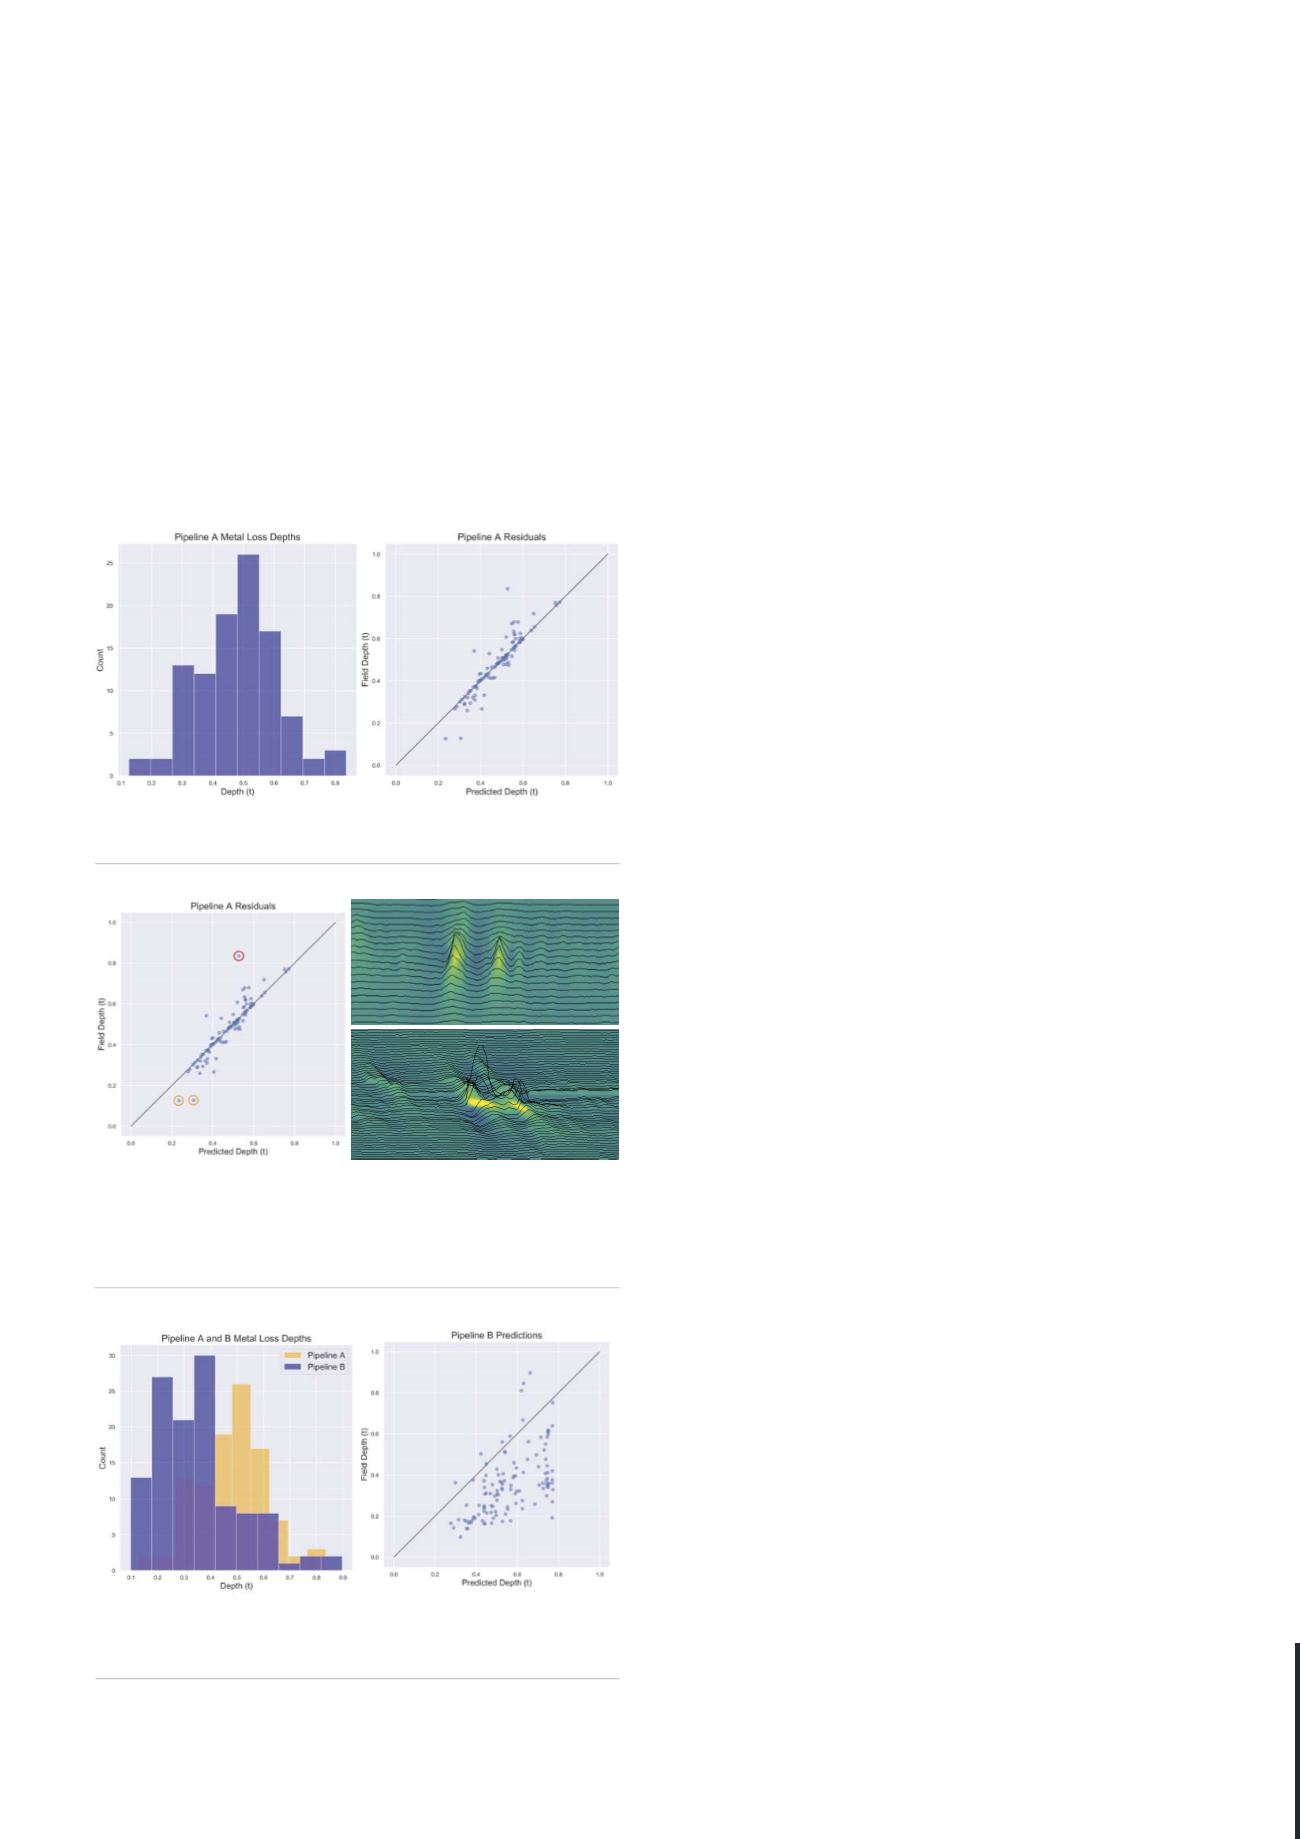
Figure 1.
Model prediction performance is closely aligned with
field results.
Figure 2.
Looking closely at the data sets shows how the outliers
came about. Top right: magnetic flux leakage (MFL) indicated two
independent metal loss signatures. Bottom right: spiral magnetic
flux leakage (SMFL) indicated on long, connected feature
consistent with selective seam weld corrosion (SSWC).
Figure 3.
When the model was tested on a blind data set,
it overestimated metal loss depths, probably due to poor
extrapolation from the input features it had learned.
60
World Pipelines
/
MARCH 2020