


 76 / 160

March
2017
HYDROCARBON
ENGINEERING
74
removed and reattached for automated UT scanning
and/or redeployment to other monitoring locations in the
facility. The transducers were placed in positions where low
spots had been identified through manual UT. The system
was powered by batteries and needed no external
connections to either power or plant IT infrastructure. Data
was backhauled on a once per reading schedule to a
cloud-based data server, and a web browser application
was used to view and analyse the data.
Atmospheric gas oil circuit
Background
Opportunity crudes continue to present the refining
industry with concerns about naphthenic acid corrosion
(NAC) of carbon steel and chromium steels in service
temperatures greater than 425˚F (218˚C). The corrosion
rate of the metal is based on a number of factors such as
naphthenic acid species, sulfur content, velocity,
temperature, silicon and chromium content (within
specification range), wall shear stress, and solids content
of stream. NAC may occur at total acid numbers less than
0.5 mg KOH/g.
3
These variables may dramatically change
the corrosion rates in a matter of weeks. Installed sensor
thickness readings at these temperatures not only provide
continuous corrosion rates, but also eliminate the concern
for proper calibration, which can greatly affect the
validity of the readings. Installed sensors can account for
temperature changes automatically; inability to track such
changes has been a common source of error. When these
sensors are used in conjunction with a corrosion inhibitor
programme, real time adjustments can be made to
optimise chemical costs with increased mechanical
integrity.
A 3 in. Sch 40 atmospheric gas oil (AGO) circuit was
selected for monitoring due to high levels of NAC in the
circuit. The piping was already subject to greater than 50%
wall loss, and the process temperature had been decreased
in an attempt to mitigate the corrosion process. A
turnaround that would replace the subject pipework was
scheduled to occur within the next 12 months, but there
was a desire to validate the sufficient reduction of the
corrosion rate so that line operation could be continued in
confidence until the next planned turnaround.
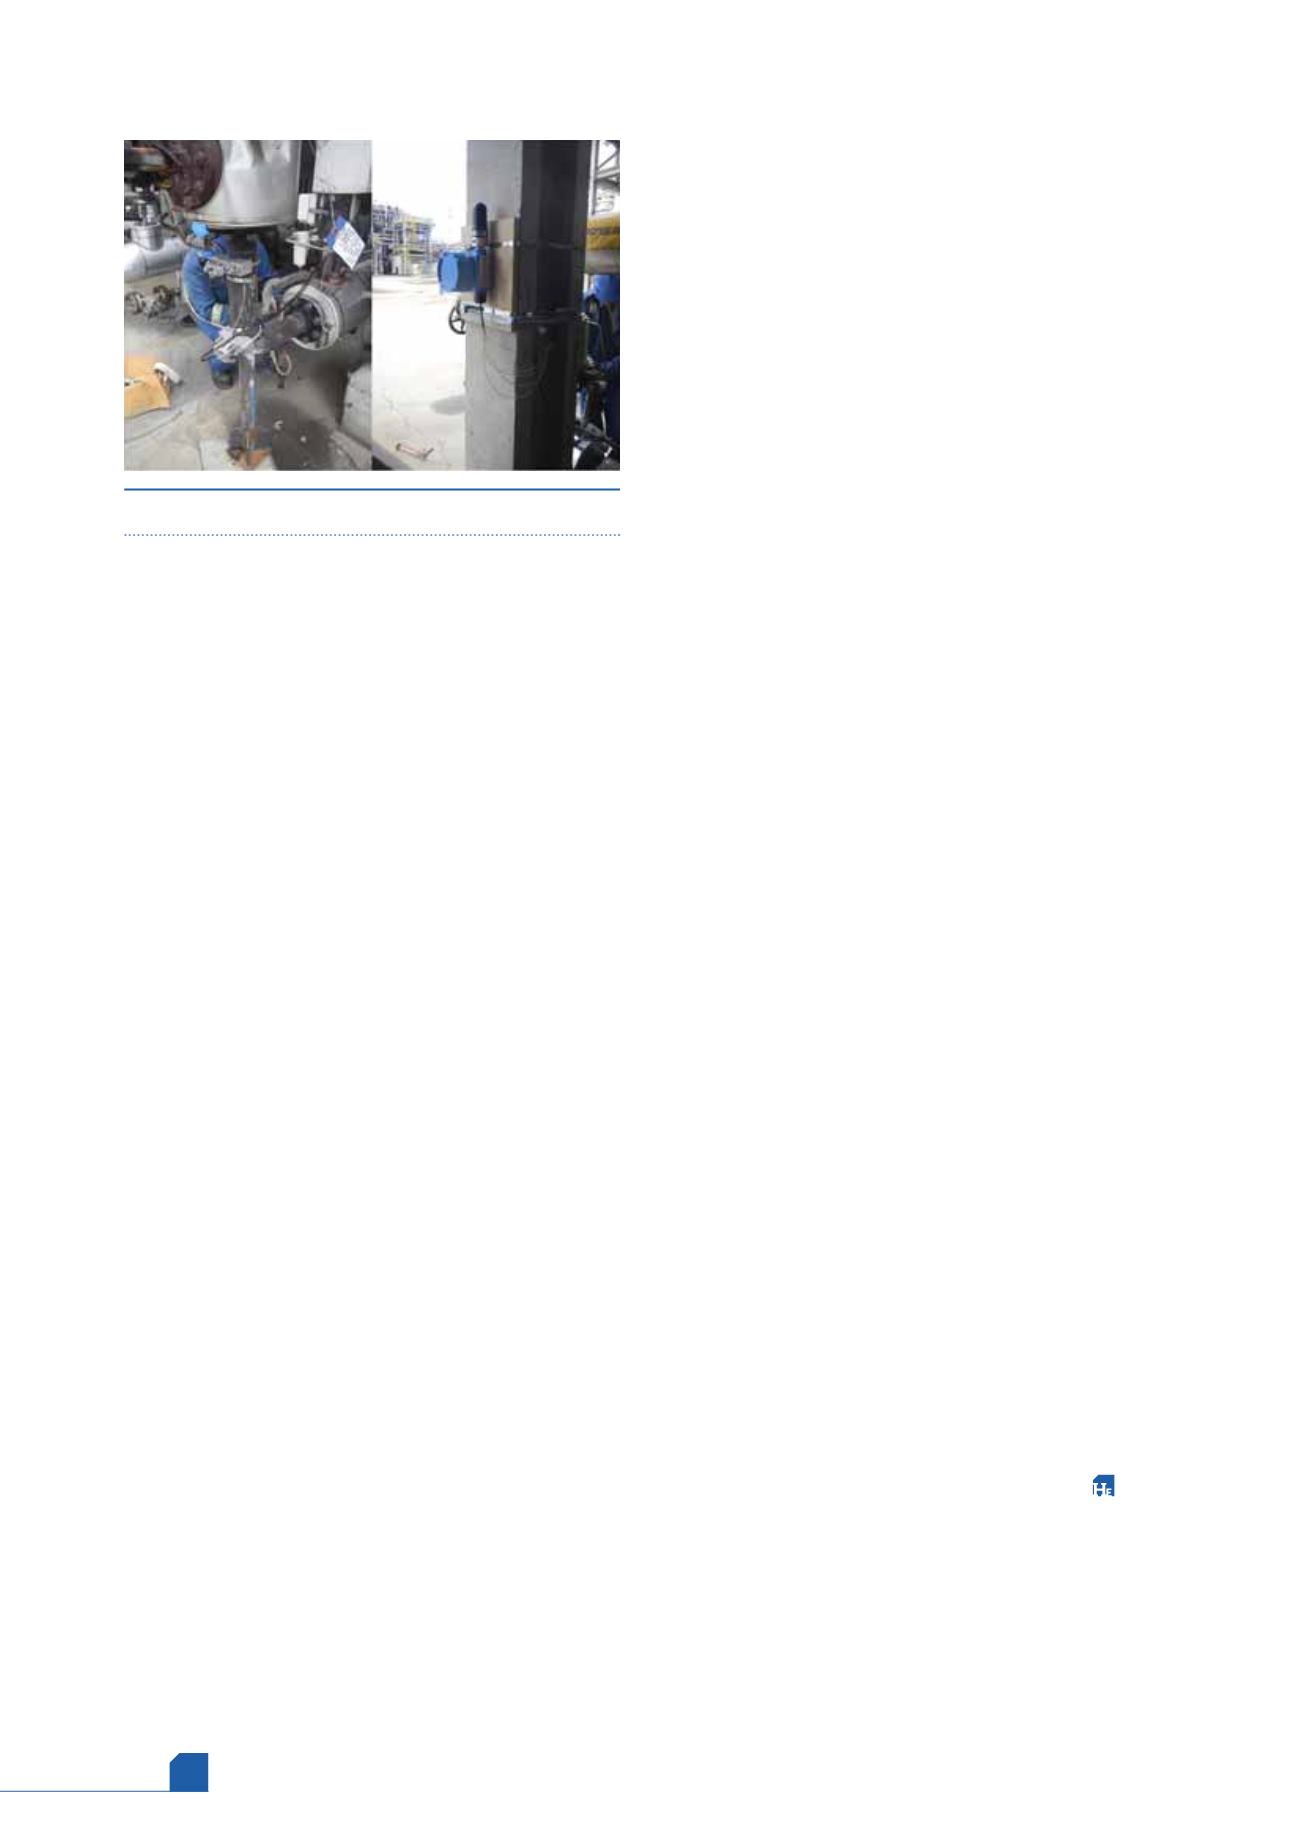
Figure 4 shows the installation of a cellular-based
ultrasonic monitoring system, including four high
temperature transducers and a resistance temperature
detector (RTD). The transducers are clamped using
brackets and U-bolts as an alternative to welding brackets
to the pipework, which would be problematic on this line
due to its remaining wall thickness. The high temperature
solution utilises a metal-to-metal coupling with a thin
gold foil acoustic couplant layer between the probe and
pipework. This type of solution is necessary for pipe
circuits operating at temperatures greater than
approximately 392˚F (200˚C), as organic adhesives or
other traditional ultrasonic coupling methods are
unreliable. Process temperatures for the subject pipework
were measured to be 662 – 752˚F (350 – 400˚C). The
system was powered by batteries and required no external
connections to either power or plant IT infrastructure.
Data was backhauled on a four hour reading schedule to a
cloud-based data server, and a web browser application
was used to view and analyse the data.
Temperature monitoring was included to compensate
for UT thickness reading variations due to temperature, as
temperature is one of the largest noise factors in installed
ultrasonic sensor data. The variation of ultrasonic velocity
as a function of temperature is estimated to be
approximately -1% per 100˚F (55˚C). Consequently, as
temperature rises, any ultrasonic thickness gauge will
measure an increase in time of flight and a corresponding
increase in thickness if the ultrasonic velocity is not
temperature corrected. For example, if a calibration is
performed on a room temperature calibration block at
70˚F (21˚C), and then, subsequently, a measurement is
performed on the same block at 970˚F (521˚C) without
adjusting the velocity, the thickness will be overestimated
by approximately 9% due to the shift in material velocity.
Conclusion
Opportunity crudes will continue to be available in
different markets at reduced costs to the refiner with
certain enhanced corrosion concerns. With the recent
developments in low cost, low power, solid state
electronics combined with lithium-ion batteries and
ubiquitous cellular Internet of Things (IoT) connectivity,
4
refiners can accurately determine real time corrosion rates
and implement a corrosion control programme to mitigate
risks associated with opportunity crudes using these new
and unique solutions. These methods, while employing
industry accepted measurement techniques, are now able
to provide reliable, accurate, high resolution wall thickness
data at very frequent measurement intervals, and are
therefore valuable to plant maintenance and corrosion
engineering departments at cost effective prices.
References
1. NUGENT, M. J. and BABAIAN-KIBALA, E., 'Naphthenic Acid Corrosion
Literature Survey', NACE Corrosion/99, Paper No. 378, (April 1999).
2. SNI 2016 NACE Paper.
3. NUGENT, M. J. and DOBIS, J. D., 'Experience with Naphthenic Acid
Corrosion in Low Tan Crudes', NACE Corrosion/98, Paper No. 577,
(March 1998).
4. Sensor Networks, Inc. USPTO Patent Applications #2016/0109411
and 2016/0274065-A1.
Figure 4.
AGO monitoring installation.