


 20 / 160

March
2017
HYDROCARBON
ENGINEERING
18
argument lost its potency. The
restrictions were seen mainly as
creating barriers to efficient trade. In
particular, LTOs from landlocked areas
had a transport disadvantage, and
they were sold at low prices to
refineries along transport routes. This
was a chief cause of the widening
Brent-WTI crude price differential
shown in Figure 1. US market prices
diverged from global prices. The
refineries with access to the
inexpensive crudes increased
utilisation, and increased their
product sales and exports.
Figure 8 compares the trend in US
crude exports with crude imports. In
2016, both imports and exports rose.
However, imports rose more than
exports, so net crude imports
increased by over 1 million bpd. Easing
the export restrictions did cause an increase in
exports, but it did not cause a decrease in
refinery supplies of crude. The opposite appears
to be happening.
How do US refineries receive
crude oil?
The US has the largest refining industry in the
world, spread from coast to coast and including
two non-contiguous states: Alaska and Hawaii.
Delivering crude to these refineries is a massive
logistical exercise. The shale boom added
another layer of complexity, since many of the
new shale plays were not connected to existing
oil transport infrastructure. This created a need
for additional transport infrastructure and the
use of alternative modes. How do US refineries
receive crude oil, and how has this changed?
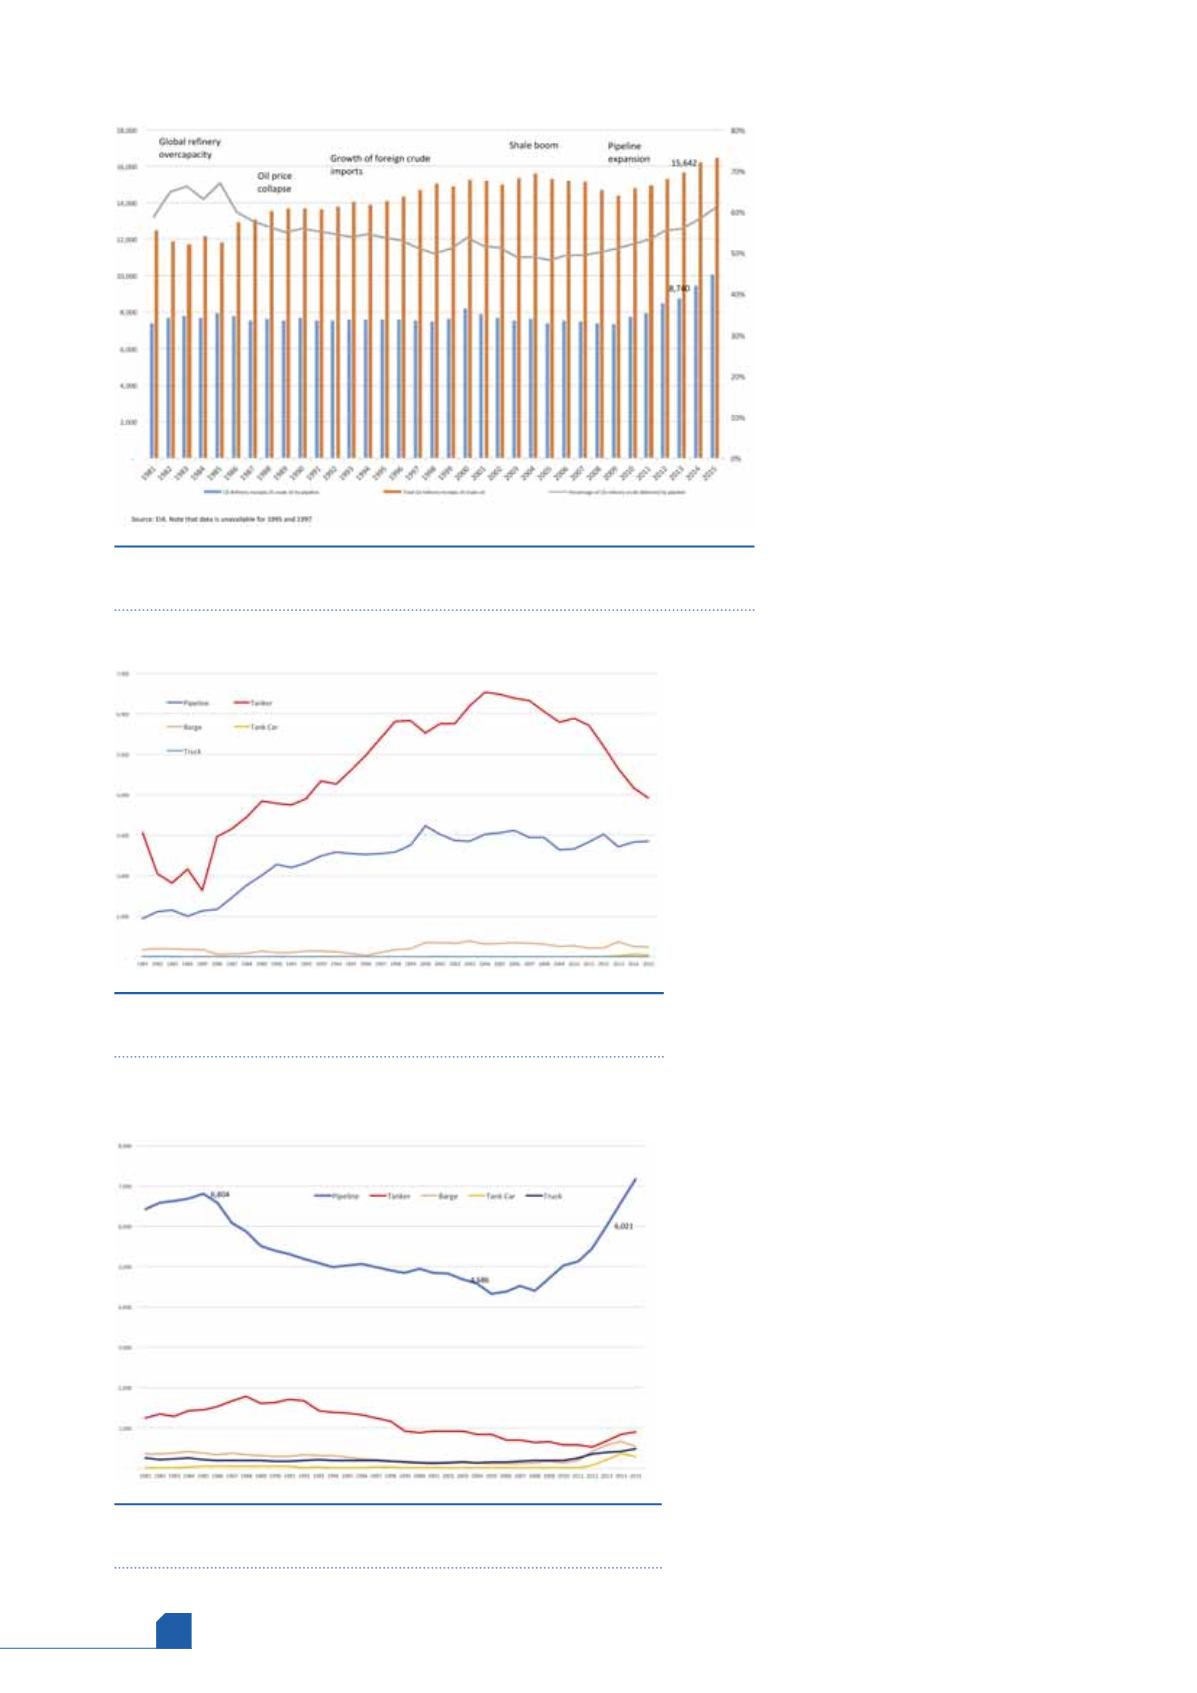
The key role of pipelines
As Figure 9 demonstrates, pipelines are the
dominant transport mode used to deliver crude
to US refineries. In the early 1980s, pipelines
delivered nearly two-thirds of crude receipts.
This slowly declined during the years from the
late 1980s until 2005, when pipeline deliveries
fell to around 48%. After 2005, however, a
resurgence in pipeline deliveries began, and in
2015, pipelines were responsible for nearly 61% of
crude deliveries. In 2015, US refineries received
16.452 million bpd of crude oil, 10.026 million bpd
of which was delivered by pipeline.
Transport modes for foreign crudes
and domestic crudes
The reason for the changing percentage carried
by pipelines becomes clear if domestic crude is
separated from foreign crude, as Figures 10 and 11
illustrate.
Figure 9.
The key role of pipelines in delivery crude to US refineries
('000 bpd and % of total).
Figure 10.
US refinery receipts of foreign crude by transport
mode ('000 bpd).
Figure 11.
US refinery receipts of domestic crude by transport
mode ('000 bpd).