


 16 / 160

March
2017
HYDROCARBON
ENGINEERING
14
US output of 4.341 million bpd is greater than the total
crude output of any OPEC country other than Saudi Arabia.
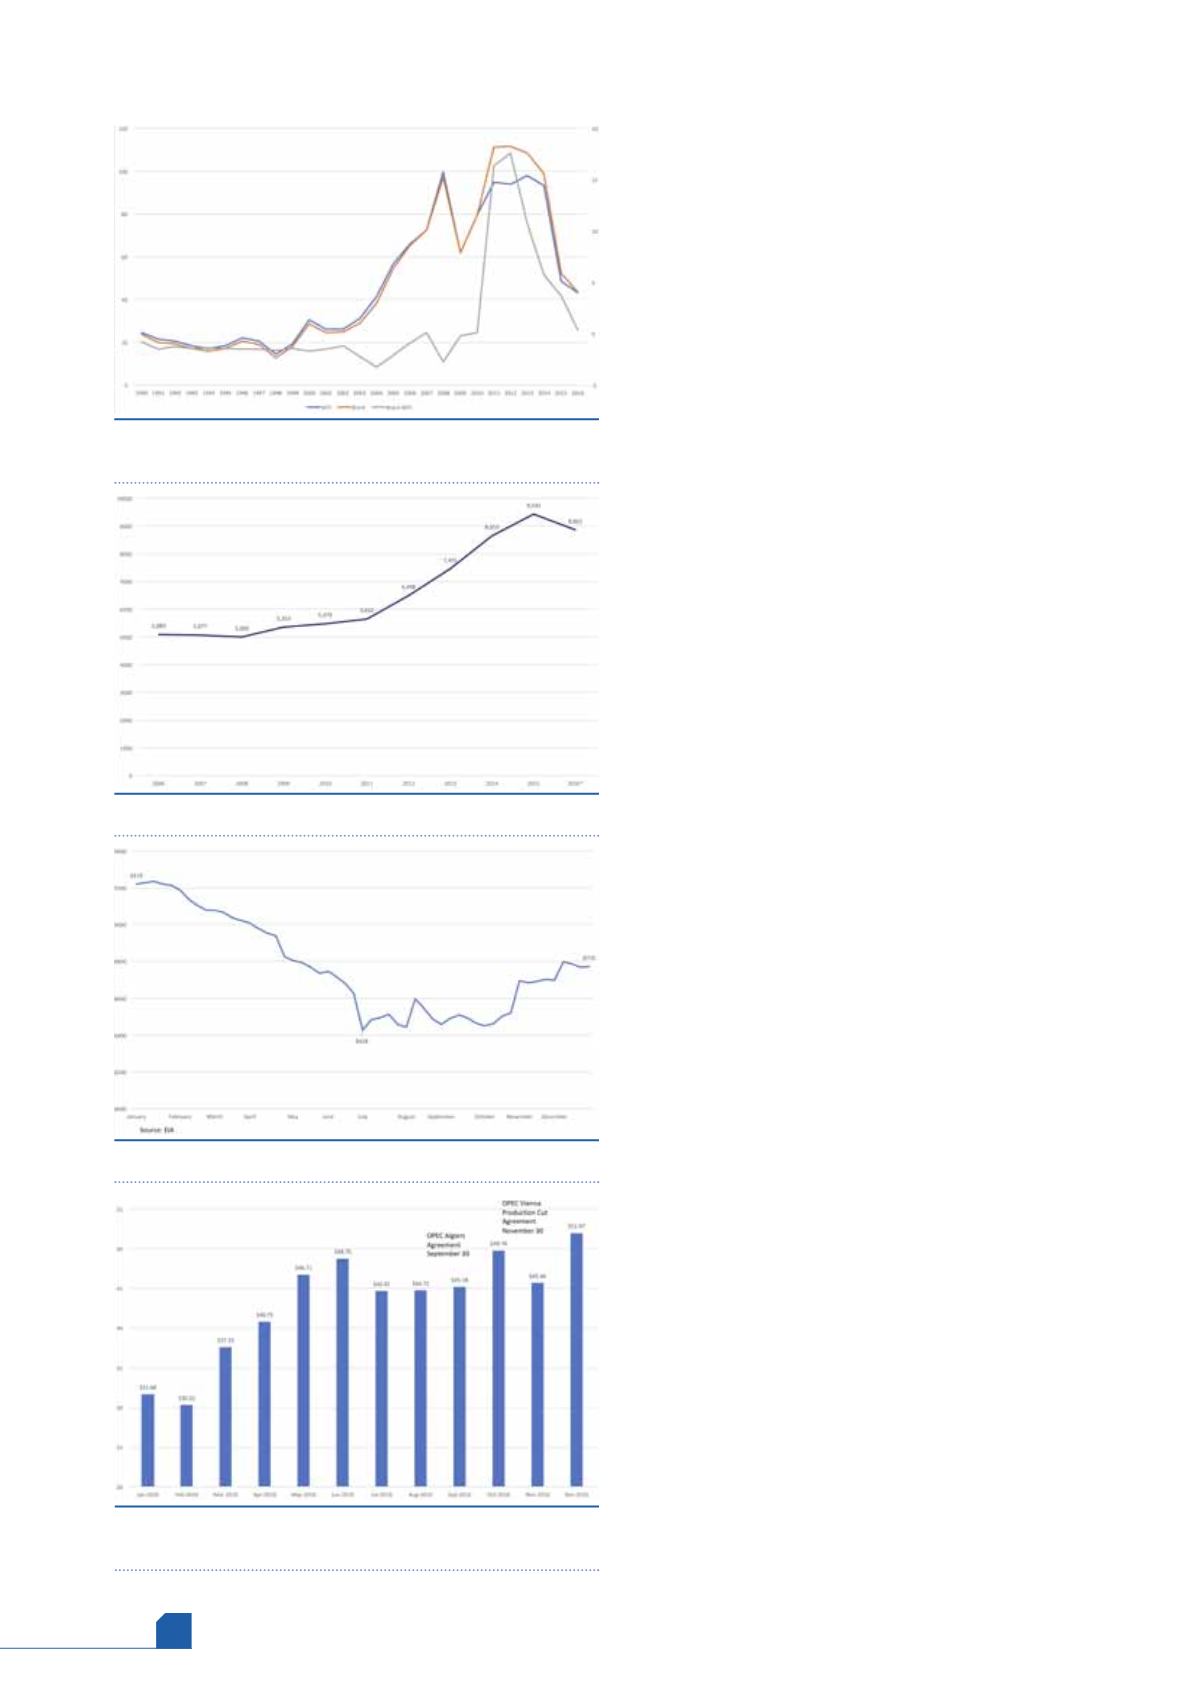
Crude prices collapsed in 2009 because of the
recession, but they rose again and hit new highs in
2011 – 2013. At this point, there was an extremely large
price differential between Brent crude and WTI crude. WTI
crude on the spot market was routinely US$15 – 20/bbl
cheaper than Brent crude, though in the past the two
crudes tracked one another closely. This was also related to
the shale boom, since a great deal of new crude was being
produced in landlocked areas, without access to a larger
customer base. Moreover, exports of domestic crude were,
until the end of 2015, restricted (not banned) by federal law.
The easing of restrictions and the logistics of getting crude
to refineries are discussed below.
By late 2014, Saudi Arabia began to raise its output. The
Saudi-led oil price war caused prices to collapse in 2015
and 2016. It was intended to be a war of attrition, where
the higher cost producers would eventually be forced to
exit the market. US shale producers were among the key
targets, since many had relatively high costs of production.
The impact was slow in coming, however, since many US
wells were already drilled and in operation. Over the
course of the oil price war, many US wells closed, and many
companies went out of business. The US producers
remaining worked to increase their drilling efficiency and
cut costs. Still, in 2016, the low prices caught up, and US
production fell to approximately 8.862 million bpd.
The market changed again in late 2016, when 11 OPEC
countries and 11 select non-OPEC countries agreed to
reduce crude production to whittle down global stockpiles
and put crude prices on an upward track. It appeared also
that global demand would finally begin to catch up with
supply in 2017. Already, US producers appear to be
benefitting from the new price cycle. Figure 3 sheds more
light on this by presenting the trend in US crude
production, according to weekly supply data during the full
course of 2016. At the start of 2016, US crude production
was 9.219 million bpd. It fell to a low of 8.428 million bpd in
July. But anticipation of a better supply-demand balance,
combined with the survival of the most efficient US
producers, brought an unexpected end to the downturn in
production. Production was flat-ish for the next few
months until autumn.
OPEC surprised market watchers when it made its
production cut pact in Algiers in late September. The OPEC
regular meeting was held in Vienna, Austria, on
30 November, and the group surprised the market once
again by cementing the production cut agreement.
Additional support was gained in December when
11 non-OPEC countries, including Russia, joined the effort
by pledging to reduce output and/or allow natural declines
in production to continue. The impact on the market has
been dramatic.
Figure 4 shows the monthly average spot price for WTI
crude. In September, the spot price averaged US$45.18/bbl.
It jumped to US$49.78/bbl in October, after the Algiers
Agreement was made. The price then dropped to an
average of US$45.66 in November, when it seemed
impossible that OPEC would manage to get an agreement
Figure 1.
Annual average WTI and Brent spot prices, and
the Brent-WTI differential (US$/bbl).
Figure 2.
US crude production ('000 bpd).
Figure 3.
US crude production, weekly ('000 bpd).
Figure 4.
WTI monthly average spot price, Cushing
(US$/bbl).