


 18 / 160

March
2017
HYDROCARBON
ENGINEERING
16
signed at its 30 November meeting. On the eve of the
meeting, the market assigned only a 30% chance that OPEC
would be able to reach agreement. When OPEC defied the
odds, and signed the production cut agreement, prices
jumped. After the successful agreement, and with the
inclusion of the non-OPEC countries, the average price of
WTI crude rose to US$51.97/bbl in December 2016.
These increases in price are also reflected in Figure 3.
Rather than continuing on the downward path, US crude
production began to rise again by late 2016. It averaged
8.77 million bpd in December 2016, approximately
340 000 bpd higher than it was at its low point in July.
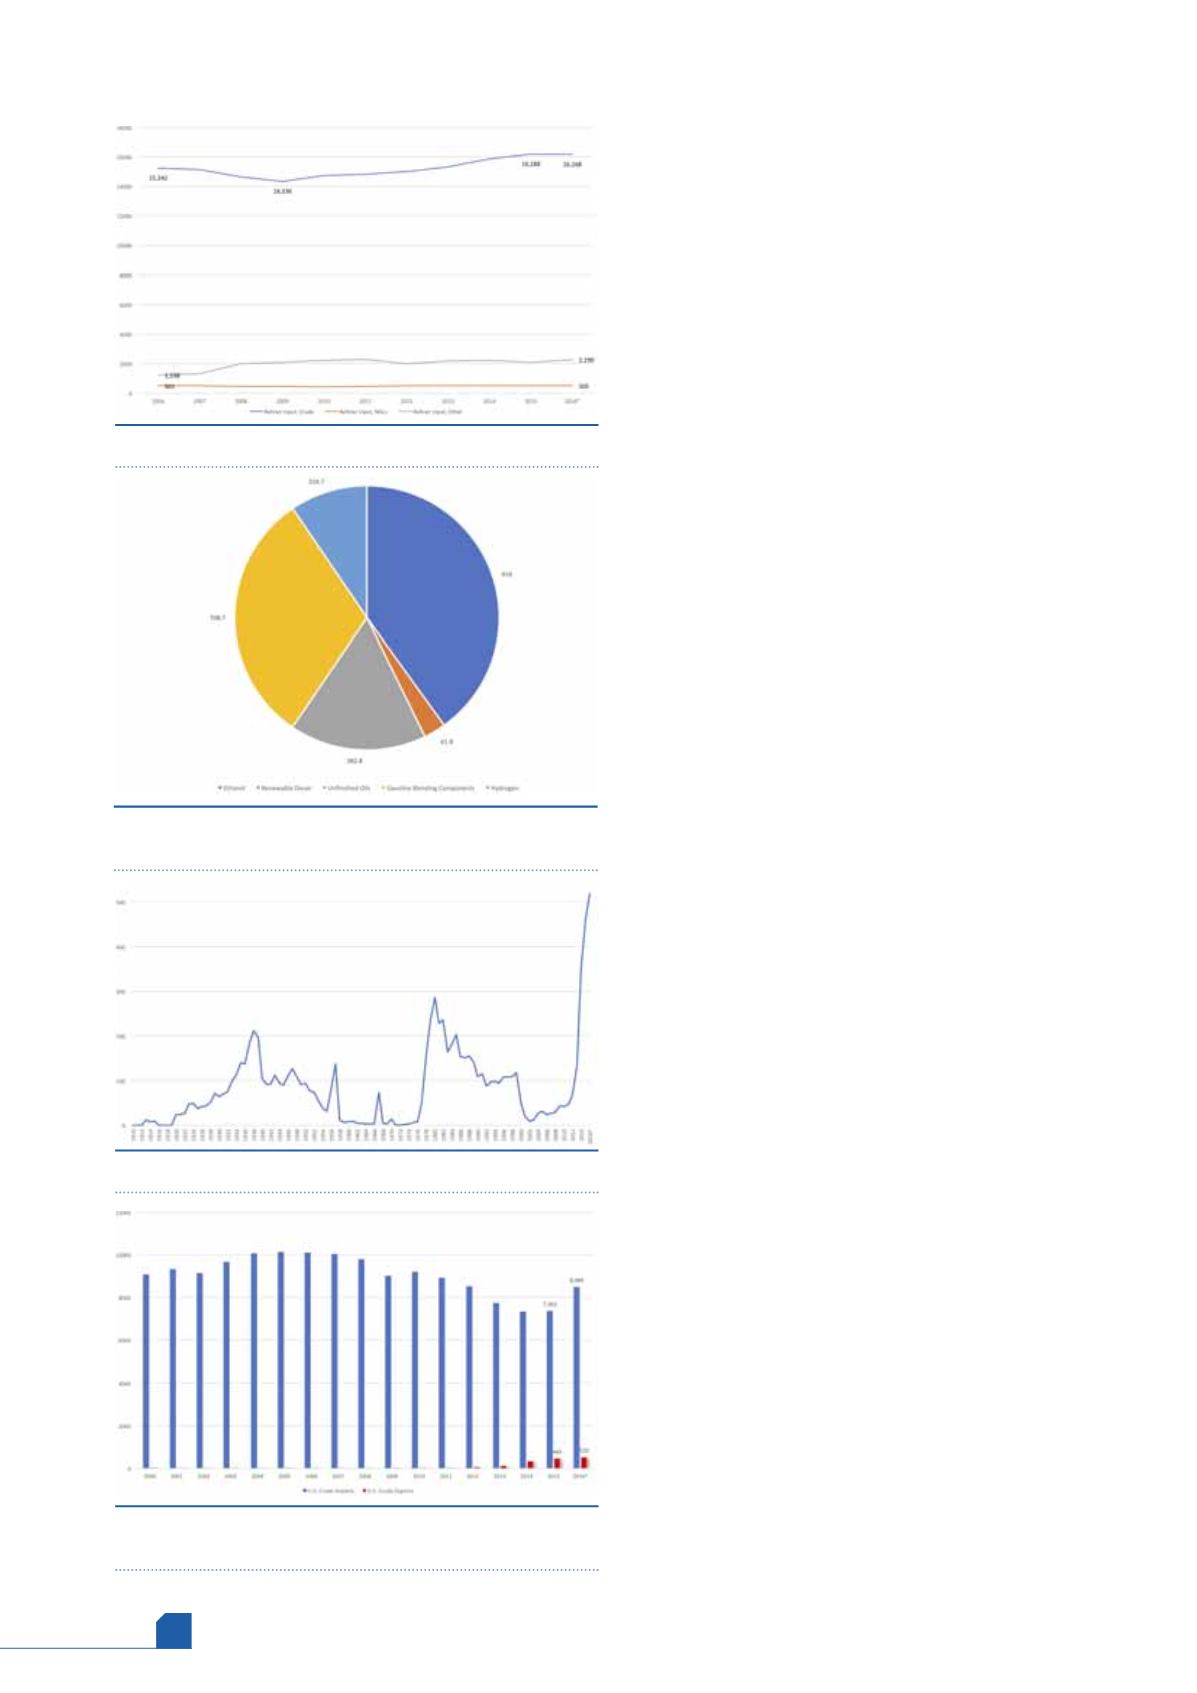
US refinery inputs and crude supply
The rise and fall in US crude production, and the location
of the crude feedstocks, is having a marked impact on US
refinery inputs and utilisation. Figure 5 presents the trend in
US refinery inputs of crude, natural gas liquids (NGLs), and
other feedstocks. Unless otherwise noted, the data used
for 2016 is the January through October average published
by the US Energy Information Administration (EIA). In 2016,
crude inputs were 1.6168 million bpd. NGL inputs were
505 000 bpd, and this level has been fairly stable over the
past decade. Other inputs were 2.29 million bpd.
The ‘other inputs’ category has grown significantly,
rising from 1.238 million bpd in 2006 to 2.29 million bpd in
2016. These non-crude inputs are mainly geared toward
meeting requirements for renewable fuels. As shown in
Figure 6, this included 916 000 bpd of fuel ethanol,
62 000 bpd of renewable diesel, and 709 000 bpd of
gasoline blending components. Together, these feedstocks
account for 74% of the ‘other input’ category. Unfinished
oils are another important non-crude feedstock. These are
mainly heavy gasoils and residuum used as feedstock for
cracking units. Net inputs of unfinished oils averaged
383 000 bpd in the January – October period.
Crude inputs dropped from 15.242 million bpd in 2006
to 14.336 million bpd in 2009. At that time, the US and
many other countries worldwide were in the grip of a
severe recession. As the recovery progressed, crude inputs
also rose, reaching 16.188 million bpd in 2015. Current year
inputs have been similar to 2015 inputs at 16.168 million bpd.
Impact of easing crude export restrictions
The year 2016 brought a new twist to US crude supply that
should increase market efficiency. In late 2015, the US eased
restrictions on crude exports. This was often mistakenly
termed ‘lifting the export ban’. In reality, crude exports
were not banned, but they were restricted to certain
trades, such as trade with Canada, exports from Alaska
state waters, certain volumes of California crude, and other
cargoes that were specially permitted. The US has been
exporting crude for over 100 years. Figure 7 shows the long
history of US crude exports since 1910. The easing of
restrictions caused a major surge in exports in 2016. They
skyrocketed to 520 000 bpd during the January – October
period.
The export restrictions had been supported by those
who believed that it would increase US crude supply
security. But with a world seemingly awash in oil, this
Figure 5.
US refinery inputs ('000 bpd).
Figure 6.
Refiner inputs of key non-crude feedstocks
('000 bpd).
Figure 7.
US crude oil exports 1910 – 2016 ('000 bpd).
Figure 8.
As US crude exports rose, so did crude imports
('000 bpd).