


 22 / 160

March
2017
HYDROCARBON
ENGINEERING
20
Figure 10 looks first at deliveries of foreign crude to US
refineries. The most important transport mode is, as might be
expected, tankers. When US domestic crude production was
declining, foreign crude imports rose. The percentage share of
tanker deliveries rose from 26% in 1985 to 47.8% in 2005. In 2005,
tankers had nearly caught up with pipelines, delivering
7.319 million bpd of crude vs pipeline deliveries of 7.387 million bpd.
After 2005, however, tanker deliveries of foreign crude slid steadily
down. In 2004, foreign crude deliveries by tanker had been
6.535 million bpd. This dropped by an incredible 2.612 million bpd,
plummeting to 3.923 million bpd in 2015.
The change in crude logistics was caused by the shale boom.
Domestic crude deliveries began to fall because US crude
production had been falling. Figure 11 displays the trend in US
refinery receipts of domestic crude by transport mode. Pipeline
deliveries peaked at 6.804 million bpd in 1985. They declined for
the next two decades, hitting the nadir at 4.325 million bpd in
2005. The ensuing decade from 2005 – 2015 witnessed a major
resurgence in pipeline deliveries, which soared to 7.168 million bpd
in 2015 as production from shale plays began to crowd into the
system, seeking refineries.
In the early days of the shale boom, pipeline capacity and
connections were unable to cope with the influx of new crudes,
and there was a scramble to correct this. Pipelines are usually
regarded as the cheapest and safest oil transport mode, but
building and expanding pipelines takes time. As Figure 11 shows,
there was growth in all other modes as well.
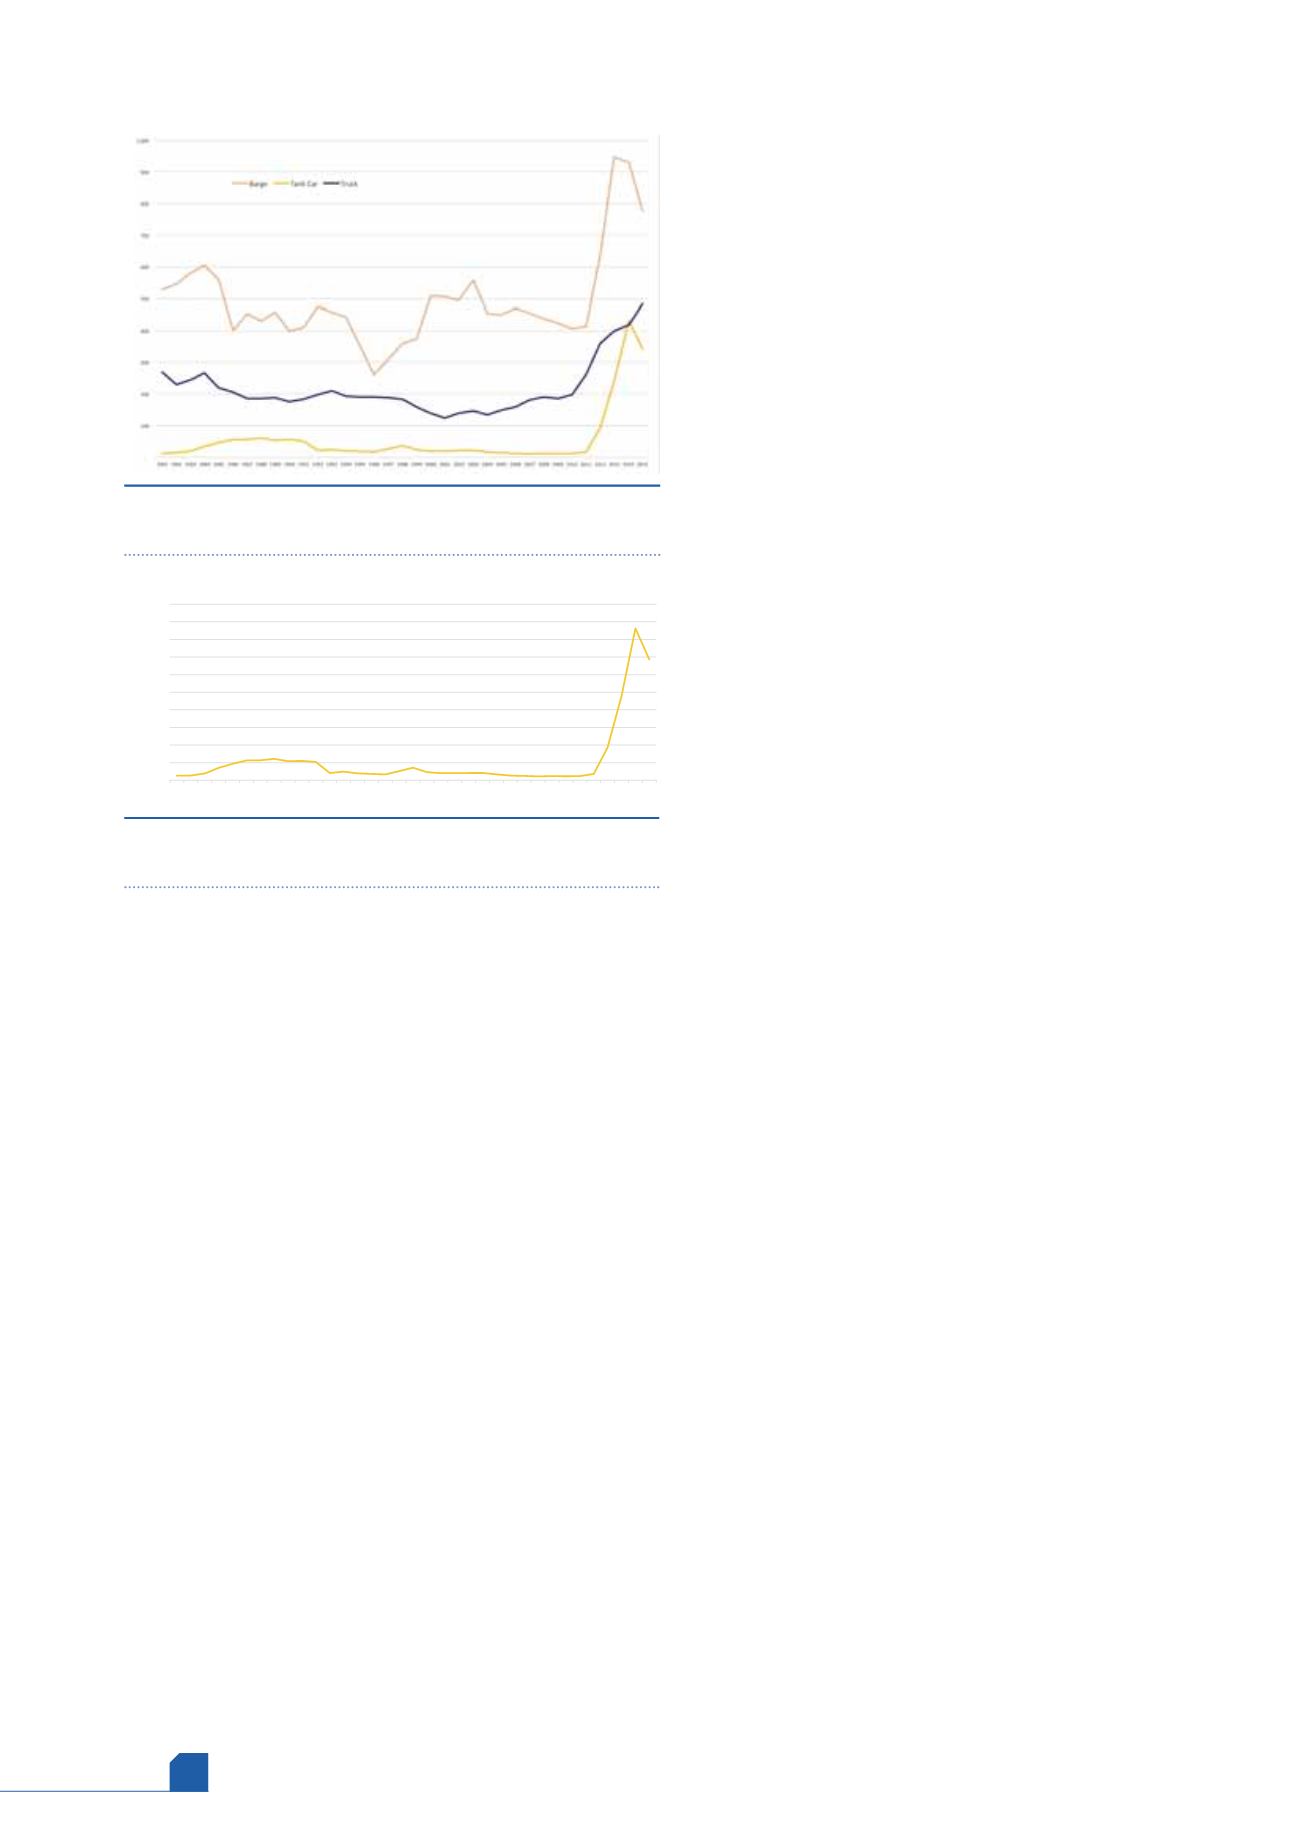
Because pipelines and tankers are such dominant modes,
Figure 12 presents the data for barges, tank cars, and trucks only.
The use of these modes surged in response to the shale boom,
growing from 604 000 bpd in 2004 to 1.779 million bpd
in 2014. The total fell to 1.602 million bpd in 2015,
however, corresponding with the decline in US
production and the completion of new pipelines.
The transport modes used to deliver crude to US
refineries have changed enormously over the past decade.
Before the shale boom, it was accepted that foreign crude
receipts would continue to grow, and that the common
modes would be tanker deliveries and pipeline deliveries.
The increase in US crude production over the past decade
strained the transport infrastructure, and refineries began
to receive more crude via barge, tank car and truck. Tank
cars were needed, for example, to deliver crude to
refineries on the East Coast and West Coast that were not
connected by pipeline to the main crude producing areas
in the centre of the country. But the use of these modes
has tailed off. First, the pipeline capacities and
connections have been expanded. Second, US production
has fallen. Many forecasts expect that the production
decline has not yet ended. If this turns out to be true, it is
logical to expect that there will be continued easing of
domestic crude transport capability, which will reduce
reliance on the more expensive modes of barges, tank
cars and trucks. If, on the other hand, higher prices in 2017
bring a resurgence of crude production in areas not yet
tied to pipeline networks, reliance on these modes may
resume.
Crude oil transport by rail
As LTO production from shale plays began to surge, US
crude transport infrastructure was strained to deliver
the new crudes to refineries. This was particularly the
case in frontier producing areas such as the Williston
Basin and the Rocky Mountains. As noted, many
pipelines were either full or did not connect with the
new output. Crude transport by rail was looked to as an
alternative mode of transportation. The expression
‘rolling pipeline’ came into use. Rail offered flexibility
that some pipelines could not. For example, there are no
crude oil pipelines that connect the Bakken crudes with
refineries in California. Building a 1500 mile pipeline
from North Dakota to Los Angeles would be
extraordinarily expensive, and it would take a feat of
engineering to get it across the Rocky Mountains. There
are many railroad connections, however, and refiners
looked to rail as a means to gain access to less expensive
domestic crudes.
Crude transported via railcar grew quickly. According
to the US Department of Transportation (DOT),
9344 carloads terminated on US Class I railroads in 2008.
In 2014, this had soared to 540 383 carloads. As Figure 13
shows, US refinery crude receipts by tank car jumped
from 18 000 bpd in 2011 to 94 000 bpd in 2012, to
239 000 bpd in 2013, and to 431 000 bpd in 2014. In 2015,
however, crude by tank car declined to 343 000 bpd.
There was less demand for rail transport, one reason
being that additional pipeline connections had been
completed.
It is also possible that safety concerns have been
turning shippers away from railcars. The rapid increase
!
&!
"!!
"&!
#!!
#&!
$!!
$&!
%!!
%&!
&!!
"*)" "*)$ "*)& "*)( "*)* "**" "**$ "**& "**( "*** #!!" #!!$ #!!& #!!( #!!* #!"" #!"$ #!"&
""
"(
*$
#$*
Figure 13.
Rise and fall of US refinery receipts of crude oil
by tank car ('000 bpd).
Figure 12.
US refinery receipts of crude by mode,
excluding pipeline and tanker ('000 bpd).