


 140 / 160

March
2017
HYDROCARBON
ENGINEERING
138
nozzles, stairways and stiffening rings. The resulting
data collected may therefore be limited to only a few
hundred data points, with some of the inaccessible
areas of tank shell missed entirely. In worst case
scenarios, the inaccuracy or absence of data can result
in costly incidents where tank integrity is lost.
In comparison to these traditional methods, a laser
scanner can collect several million data points,
providing detailed information about the tank and the
surrounding area without the need to be in contact
with the tank. Laser scanning can be used to
accurately map entire facilities as well as provide
bund volume calculations and modelling of all local
pipework and their supporting structures. This
technique helps to minimise human error and leaves
the client with a much higher resolution, detailed
report that can be exported as electronic files that are
compatible with the clients’ design software, such as
2D computer aided design (CAD) files.
During the calibration of a storage tank, the
traditional method would involve taking reference
from a strapping table to calculate tank volume. A
global positioning system (GPS) workstation would
also be used for the purpose of finding the centre
point of the tank. Following this, the distance from
the centre point to the tank wall would be manually
calculated using a tape measure. Typically, in one
working day, approximately 160 different points would
be measured from the centre to the internal wall. In
comparison, a laser scanner collects millions of
reference data points within minutes, saving
considerable time for plant personnel and money for
the asset owner. By comparing either an existing
internal scan, or the original fabrication drawings, with
the external scans, the deadwood volume inside the
tank can be accounted for – providing in-service tank
strapping tables.
The scanning process
Following the scanning of the tanks, the files are
registered and imported into Advanced 3D Laser
Solutions' (ALS) analysis software. Data that is not
associated with the tank analysis, including stairs,
pipework and manways, are then removed from the
file. The analysis process is able to rationalise overlaps
in scan data while it simultaneously creates a
deviation map. Selected radial cuts and later
segmental cuts prepare the file for reporting radial
and vertical alignment. Further analysis performed on
the tank skirt is then processed in order to prepare a
tank settlement report. Finally, the captured data on
surrounding bunds is processed to calculate the
overall bund volumes.
Individual 3D laser scans can be combined to
produce a ‘point cloud’ file, giving the client a clear
view of shell verticality, shell plate radial deflection,
tank settlement and bottom edge differential
settlement. Consequently, as well as providing
cut-through views of the tank from both the X and Y
axis, 3D laser scanning eliminates the need for ‘dumpy
Figure 1.
Buried tank showing inside deviations of
shell plate internally.
Figure 2.
Overview of typical tank terminal scan.
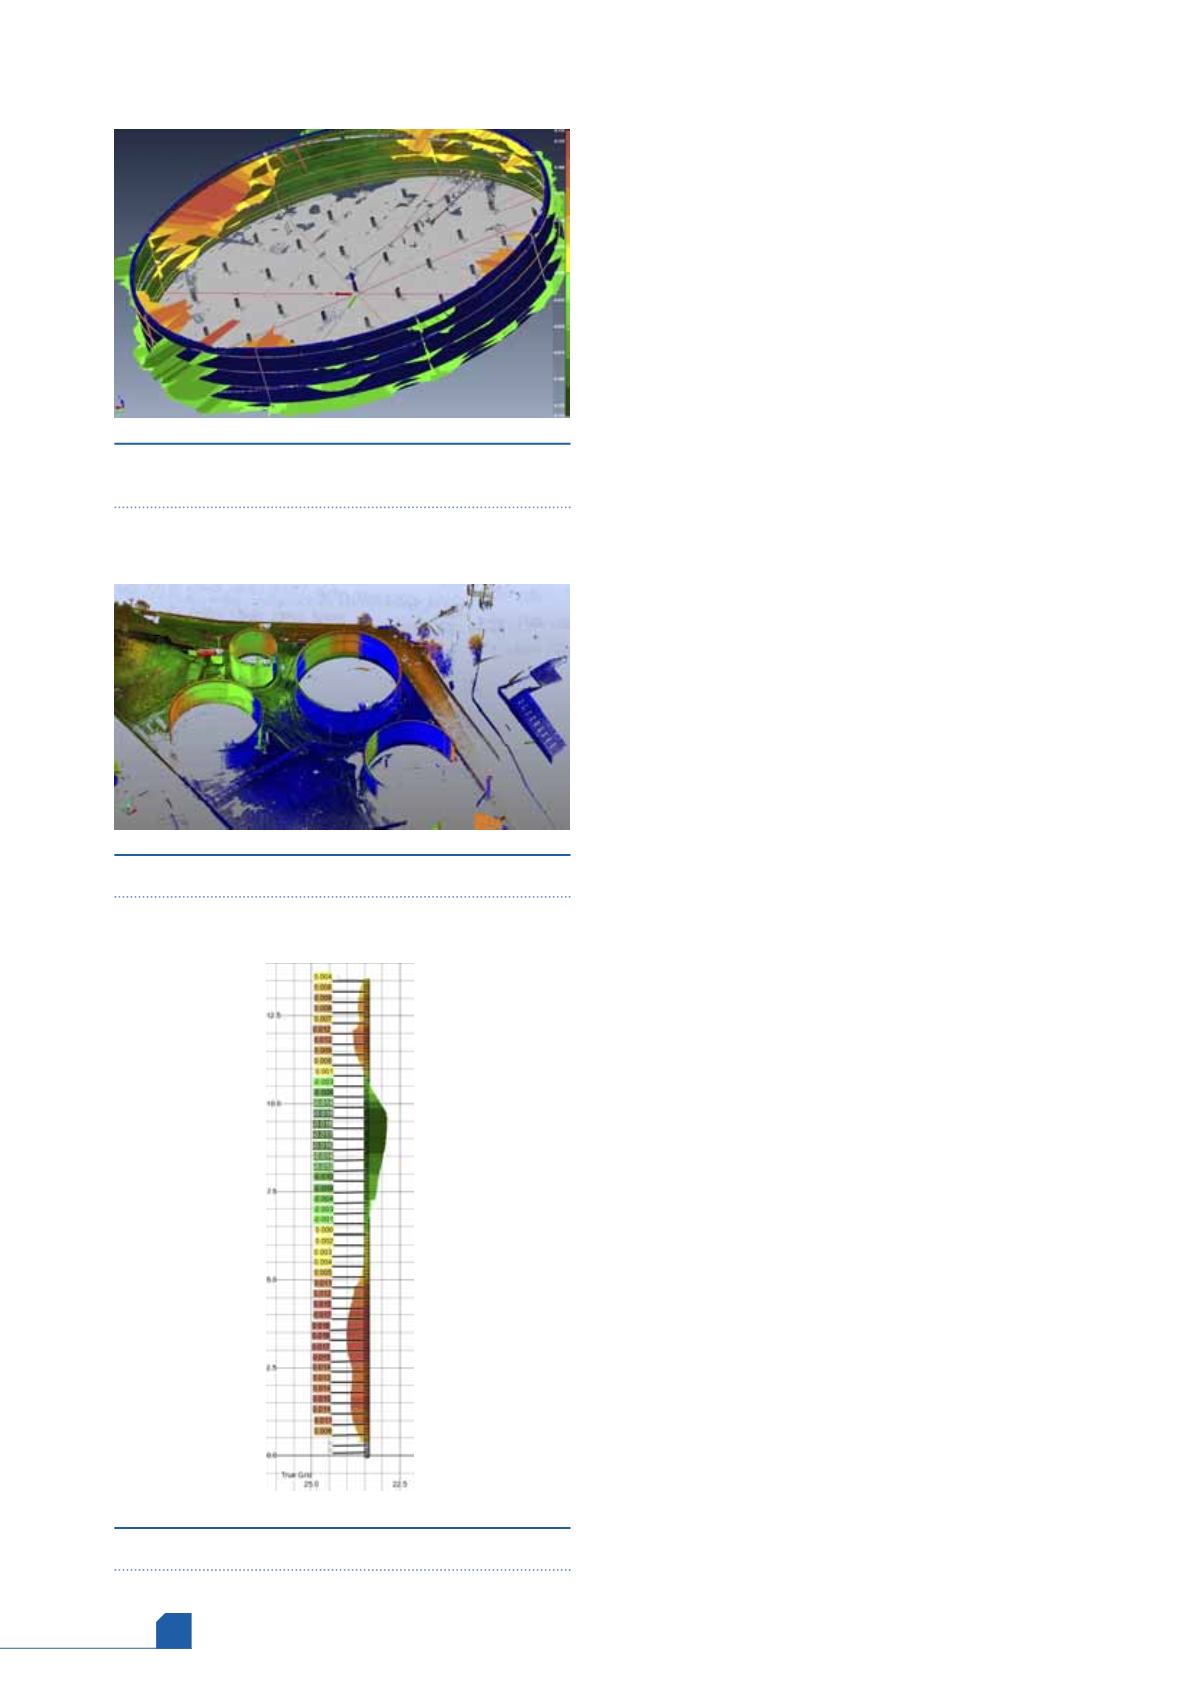
Figure 3.
Typical shell plate displacement on Y axis.